This morning, I discovered an interesting statistic, “America Has Been At War 93% of the Time – 222 Out of 239 Years – Since 1776“, i.e. the U.S. has only been at peace for less than 20 years total since its birth. I wanted to check, get a better understanding and look at other countries in the world.
As always, we can try to extract information from wikipedia, since there are pages dedicated to that information
url="https://en.wikipedia.org/wiki/List_of_wars_involving_the_United_States"
download.file(url,destfile = "warUS.html")
url="https://en.wikipedia.org/wiki/List_of_wars_involving_France"
download.file(url,destfile = "warFR.html")
url="https://fr.wikipedia.org/wiki/Liste_des_guerres_de_la_France#Premi.C3.A8re_R.C3.A9publique"
download.file(url,destfile = "guerre.html")
url="https://en.wikipedia.org/wiki/List_of_wars_involving_Canada"
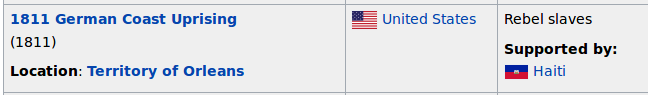
download.file(url,destfile = "warCAN.html")If we look at the US page, there are tables, so it should be easy to extract it. For instance,
Even if the war did last 1 day, we will say that the US were at war in 1811. The information we want to confirm can be “there were 21 full years – from Jan 1st till Dec 31st – where the US were not at war, once, during those years“. From the row above, we can claim that the US were at war in 1811. Most of the time, we have
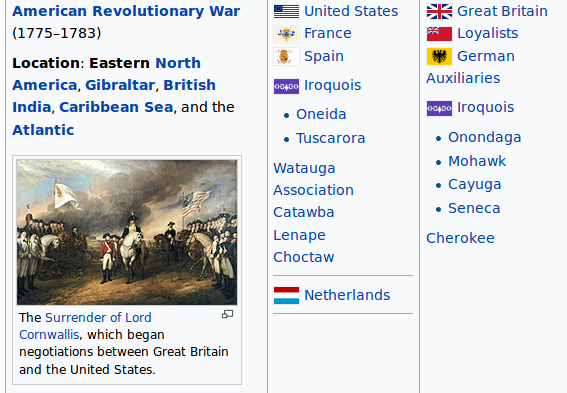
I.e. there is a beginning (here 1775) and an end (1783). So here, the US are said to be at war in 1775, 1776, 1777, 1778, 1779, 1780, 1781, 1782, 1783. To extract the information, we look for regular expressions in the first column, with number, on 4 digits.
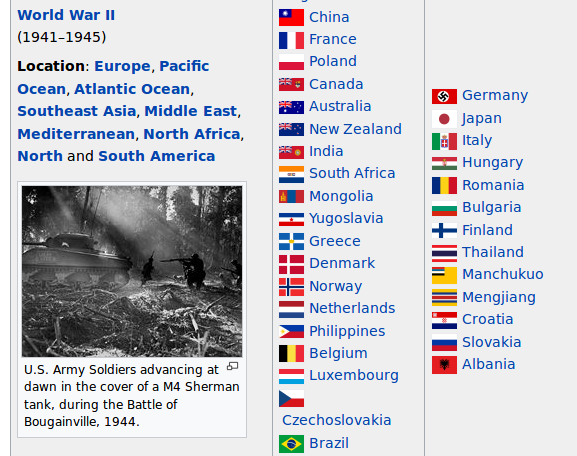
Well, sometimes it can be a bit tricky, since we have 3 dates, 1941, 1945 and (in the legend) 1944. But if we consider the minimal and the maximal dates, we have our range of dates.
Now that we we how to extract information, let’s do it. The code will be
  library(stringr)
  ext_date=function(x){
  dates12="[0-9]{4}"
  #grep(pattern = dates2, x = col1[1])
  L=str_extract_all(as.character(x),dates12)
  return_L=list()
  if(length(L)>0){
  for(j in 1:length(L))
  if(length(L[[j]])==1) return_L[[j]]=as.numeric(L[[j]])
  if(length(L[[j]])>=2) return_L[[j]]=seq(min(as.numeric(L[[j]])),max((as.numeric(L[[j]]))))
  }
  return(return_L)}
For the US, we get the following years
library(XML)
tables=readHTMLTable("warUS.html")
list_dates=list()
for(i in 1:length(tables)){
if(!is.null(dim(tables[[i]]))){
if(ncol(tables[[i]])>1){
col1=tables[[i]][,1]
list_dates[[i]]=lapply(col1,ext_date)
}
}}
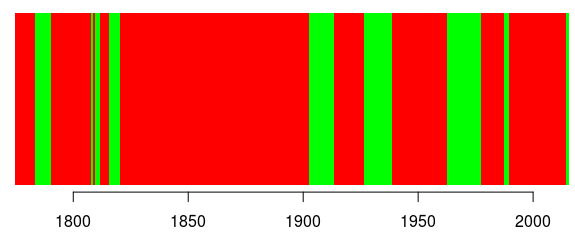
d=unique(unlist(list_dates))
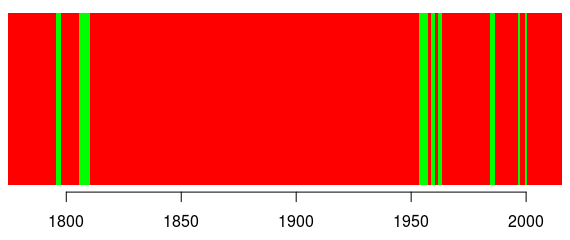
(red means at war, while green means no-war) and indeed,
> length(d)
  [1] 222
there were 222 years with war. Now, what about another country. Like France. Here I use the French wiki page, since information is not in tables in the English one.
tables=readHTMLTable("guerre.html")
list_dates=list()
for(i in 1:length(tables)){
if(!is.null(dim(tables[[i]]))){
if(ncol(tables[[i]])>1){
col1=tables[[i]][,1]
col2=tables[[i]][,2]
col12=paste(col1,col2)
list_dates[[i]]=lapply(col12,ext_date)
}
}}
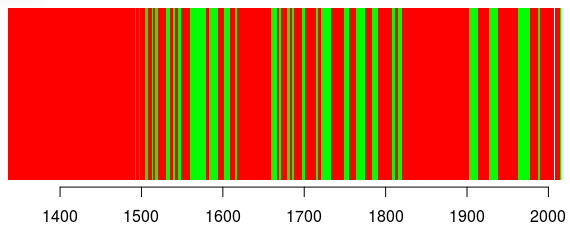
d=unique(unlist(list_dates))On the same period of time (starting in 1775), France was also on war most of the time.
Less than the US, but still: 185 years with war,
> length(d[d>=1775])
  [1] 185
And on a longer period of time? Why not start, say, around the Hundred Years’s War,
meaning that since 1337, there were (only) 174 years without a single war where France was involved.
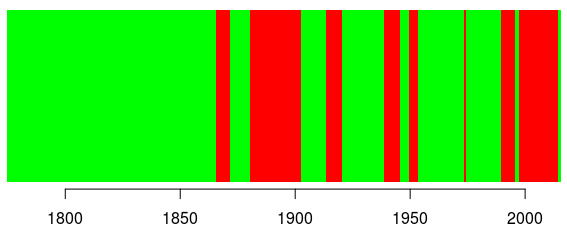
Let’s try another one. Like Canada,
tables=readHTMLTable("warCAN.html")
  list_dates=list()
  for(i in 1:length(tables)){
  if(!is.null(dim(tables[[i]]))){
  if(ncol(tables[[i]])>1){
  col1=tables[[i]][,1]
  list_dates[[i]]=lapply(col1,ext_date)
  }
  }}
  d=unique(unlist(list_dates))
Guess what… there’s a lot of green on that graph. Surprised?
notes from the interweb