Since 1984, the US has seen a profound shift in wealth as house values in blue states have risen far more than those in red states, researchers find

America has seldom been so divided going into a general election. And that division is showing up even in the housing markets of states that traditionally vote Democratic and those that vote Republican.
A new report issued by a real estate data company, HouseCanary, and given exclusively to the Guardian found that over the last four decades, housing prices have risen significantly higher in blue (Democratic-leaning) states than in red (Republican-leaning) states.
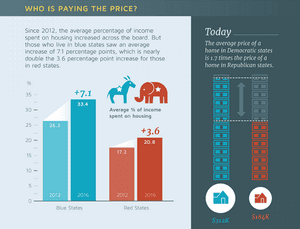
Since 1984, blue states have seen their house values go up from an average of $85,000 to $312,000, while red states saw an increase from $75,000 to $184,000. Blue states now account for 77% of the total value of homes in United States.
Higher housing prices in the liberal-leaning blue states might have a twofold effect on voters’ outlooks: while homeowners feel the benefits of the economic recovery, those who do not own homes are grappling with the effects of income inequality as house prices increase – often out of their reach.
The prices also show a profound shift in wealth in the US.
“If you look at 20 to 30 years ago, Republican red states had higher net worth than Democrats in blue states. And now what you are seeing is this sea change happening where there is this growing divide in our country,” said Jeremy Sicklick, co-founder and chief executive of HouseCanary. “This helps illustrate some of the appeal that probably Donald Trump has had in some of these red states, where there have been these factory closures and exodus from these once proud industrial centers in the north.”
As this trend played out, those people who had resources to move to places with more jobs did so, contributing to this growing inequality, explained Sicklick.
The divide between blue states and red states is likely to continue growing. According to HouseCanary, over the next three years, house values in all states are likely to grow between 10% to 12% – but those increases will look significantly different in blue states and in red states.
“At this point, the average home in a blue state is [worth] almost double [the price] in a red state, and because of that, you are going to see this continued divide. Over the next three years, we expect the average homeowner in blue states to grow their value by $39,000 to $40,000 – versus in red states, [where] the average homeowner will grow their value by $20,000,” said Sicklick.
To determine which states were blue states and which were red states, HouseCanary relied on elections and the statistical analysis website FiveThirtyEight’s projections for the 2016 presidential elections. The projections used were released on 16 August. According to Sicklick, even if some of the swing states were to end up voting Republican instead of Democratic as predicted in the projections, the analysis would still hold up.
“I don’t think any swing state changes – whether they are Ohio or Iowa or other swing states – would have a material impact on the overall findings,” he said.
After all, not all blue states are equally expensive. The concentration of wealth can mostly be found in coastal power centers and America’s megacities, such as Los Angeles, San Francisco and New York. Then there are also Washington DC, Boston and Seattle – all of which tend to be expensive to live in.
Just look at Donald Trump’s hometown. Earlier this year, the average price of a Manhattan apartment surpassed $2m. Brooklyn apartments have hit a post-recession high at $600,000. Another study found that rents in Brooklyn went up by 50% from 2009 to 2016, with median monthly rent on an entry-level apartment reaching $2,481.

“We are seeing blue states have basically 77% of the total value of homes in United States, which is quite staggering and part of it is definitely tied to where these large cities are located,” said Sicklick.
And while increasing prices have been beneficial for current homeowners, whose assets are going up in value every year, they have had adverse effects on renters and those looking to buy homes.
“This trend has come at a cost as well,” said Sicklick. “When we look at what’s really happening in these blue versus red states, basically the affordability or the percent of income that is used for the average home payment in blue states is now over 33% versus 20% in red states.”
In the second quarter, ending on 30 June, the US census found that US homeownership fell to 62.9% – the lowest it has been since 1965.
