
| May 2016: | 407.70 ppm |
| May 2015: | 403.94 ppm |
Last updated: June 6, 2016
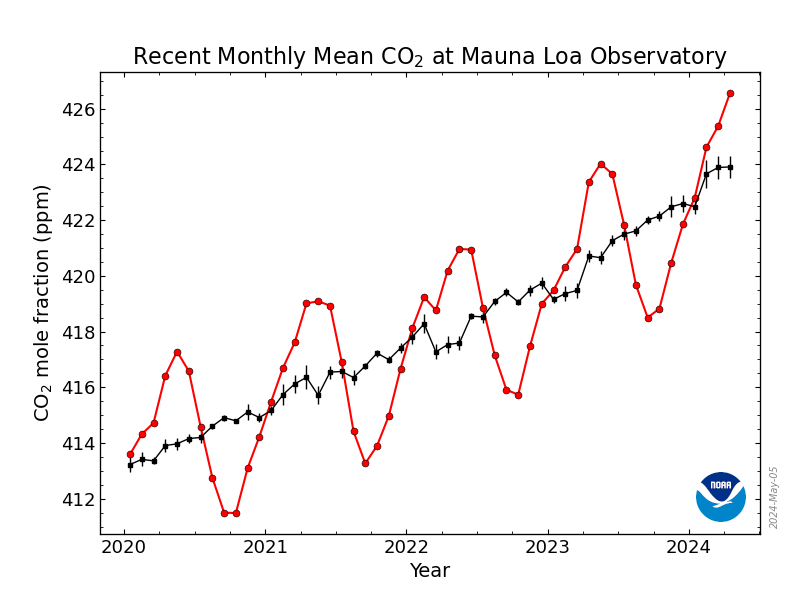
The graph shows recent monthly mean carbon dioxide measured at Mauna Loa Observatory, Hawaii.
The last four complete years of the Mauna Loa CO2 record plus the current year are shown. Data are reported as a dry air mole fraction defined as the number of molecules of carbon dioxide divided by the number of all molecules in air, including CO2 itself, after water vapor has been removed. The mole fraction is expressed as parts per million (ppm). Example: 0.000400 is expressed as 400 ppm.
In the above figure, the dashed red line with diamond symbols represents the monthly mean values, centered on the middle of each month. The black line with the square symbols represents the same, after correction for the average seasonal cycle. The latter is determined as a moving average of SEVEN adjacent seasonal cycles centered on the month to be corrected, except for the first and last THREE and one-half years of the record, where the seasonal cycle has been averaged over the first and last SEVEN years, respectively.
The last year of data are still preliminary, pending recalibrations of reference gases and other quality control checks. The Mauna Loa data are being obtained at an altitude of 3400 m in the northern subtropics, and may not be the same as the globally averaged CO2 concentration at the surface.