The rich are moving in: As the poor and middle-class are displaced, Census figures show a dramatic increase in the number of very wealthy residents of San Francisco
By Darwin Bond Graham
Yahoo began running its hulking purple buses into San Francisco in 2005. Google followed two years later with a bus system that one company executive described as “a small municipal transit agency.” The median home prices had climbed relentless upward from about $400,000 in 2000 to about $700,000.
Tech giants like Salesforce and Google had just had their IPOs and were considered speculative bets. Salesforce had only 767 employees in 2005; today the company counts 4,000 workers just in San Francisco. Google has 2,500 San Francisco employees. And Twitter didn’t exist, but now it packs another 1,500 employees into the city, according to an estimate by the San Francisco Business Times.
It was exactly around this same time that the city’s demographics were starting to be rapidly up-ended — not only because of the displacement of thousands of poor and middle class households, but more so by the arrival of tens of thousands of affluent and even super-rich households.
This is the less-discussed side of the tech boom – the influx of the wealthy. An analysis of US Census data shows a dramatic trend: If the city continues on its current path, the population will soon be dominated by the upper five percent of all earners.
It hasn’t been all tech’s doing. San Francisco’s finance, real estate, law, and medical companies, to name just a few industries clustered here, have expanded quite a bit over the past decade. San Francisco has become more and more a headquarters to elite global corporations and the smaller professional firms that support them.
All sorts of factors are causing divergence in incomes, splitting the greater Bay Area metropolitan region into two increasingly polarized populations. At the top is about ten percent of the workforce whose pay has increased dramatically in real terms over the past couple decades. These include the “superstars” of the new economy who squeeze giant incomes from mostly managerial positions in large corporations.
The bottom 50 percent is experiencing a decline of pay in real terms, in addition to higher likelihood of unemployment. The middle 40 percent, the so-called middle class, is also increasingly being squeezed, with many people falling downward, and a few ascending upward.
San Francisco is becoming a city with an unusually large number of top income earners, an island of wealth and privilege surrounded by stagnating middle class suburbs and working class ghettos. Payroll tax breaks, rapidly re-inflating real estate prices, exclusionary zoning and development policies in affluent suburban cities, and pockets of speculative development in older urban cores, among other factors, are combining to push the poor and middle class out of San Francisco in unprecedented numbers. But the affluent arrive in greater droves.
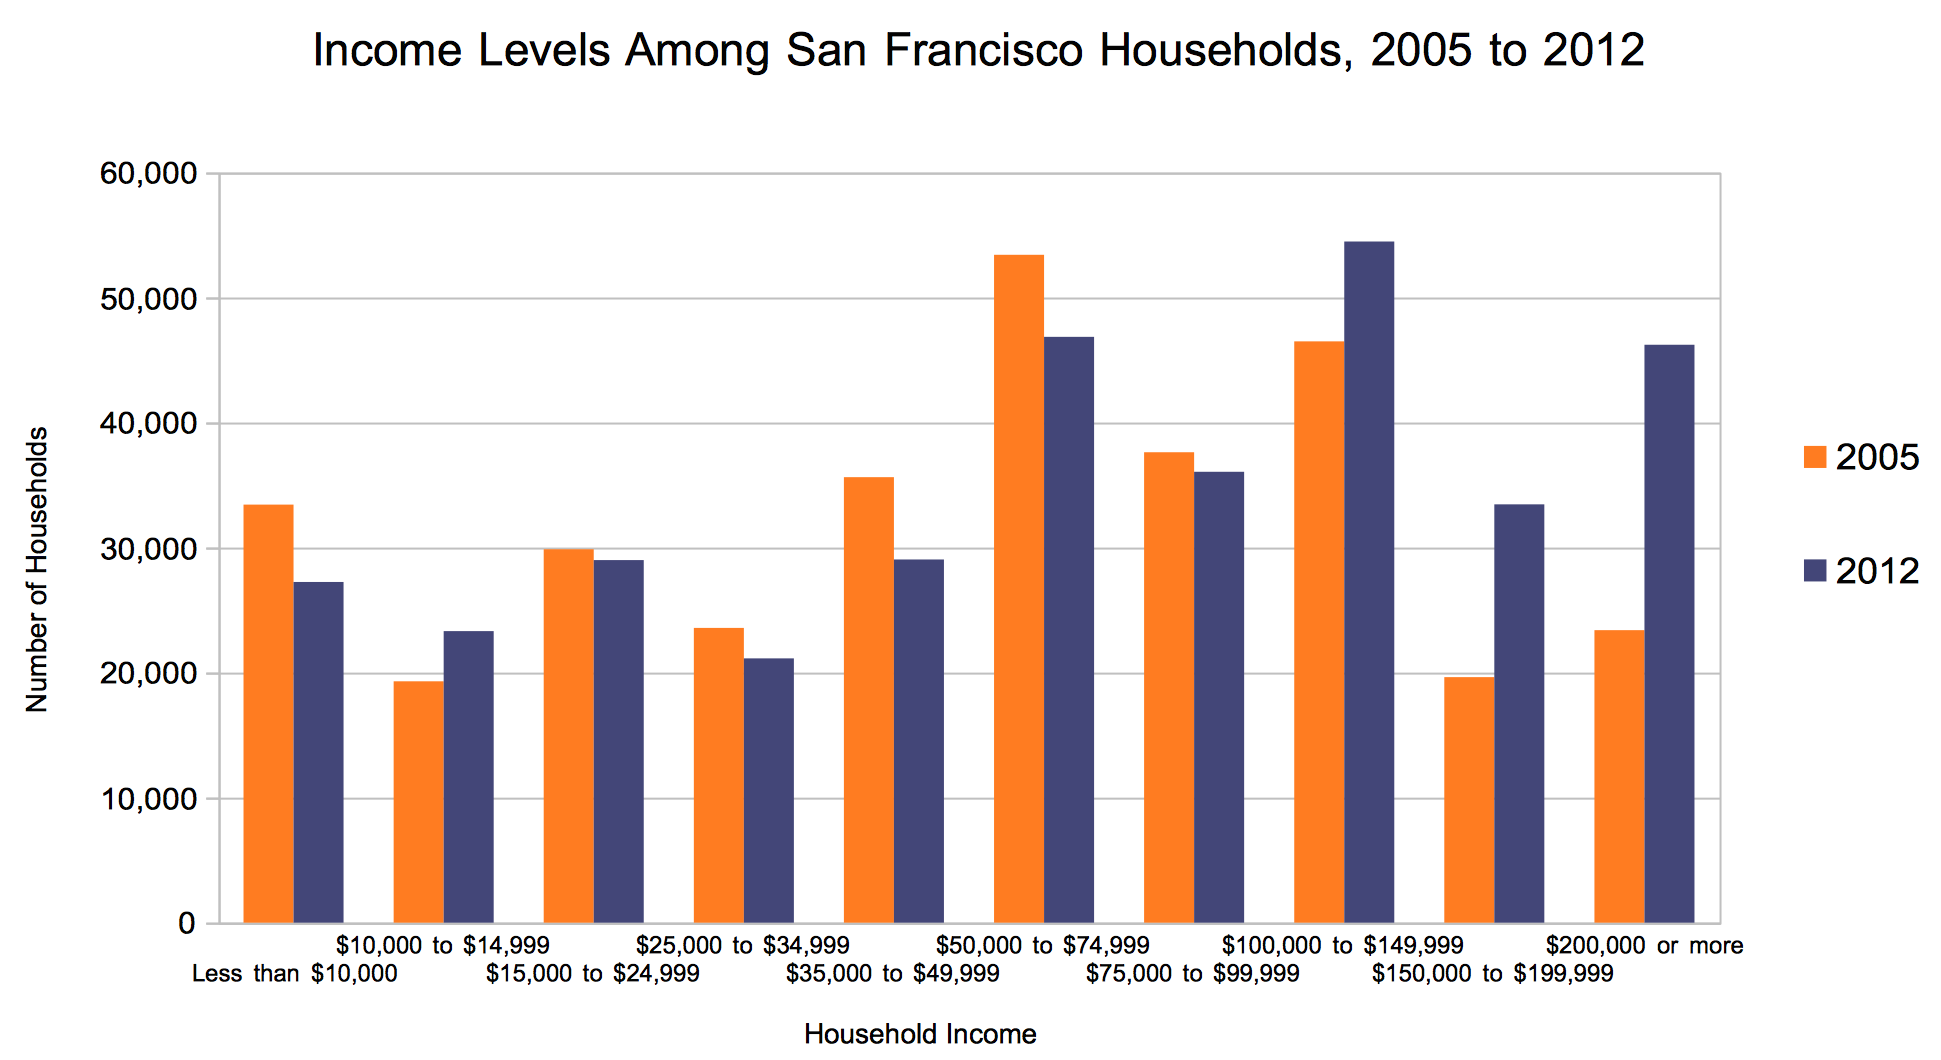
In 2005, when the first tech buses were making runs up Van Ness and Valencia, there were approximately 33,400 households in San Francisco whose annual income was less than $10,000. Conversely, there were only 23,300 households in the city whose reported annual income was above $200,000, according to numbers obtained from the U.S. Census’ American Community Survey.
Fast forward seven years, seven arduous years spanning the global financial crisis and waves of foreclosures and job losses — but seven years that also witnessed the explosion of tech company earnings and the rise of giants like Google and Facebook.
In 2012, the most recent year for which data is available, the rich and the poor changed places. The number of households in San Francisco with a reported annual income above $200,000 exceeded those earning less than $10,000. There are now upwards of 46,200 households raking in above $200,000 a year, while the number of households subsisting below $10,000 has actually declined by approximately 6,200, to about 27,300.
San Francisco is rapidly adding wealthy households, while its poorest households slowly disappear.
Perhaps this is because the city’s poorest households are becoming richer and moving into the upper range of earnings? Not likely.
There is the possibility that some of the households below the $10,000 income line in 2005 had by 2012 moved upward into the next income brackets. Indeed there’s a curious and anomalous growth in the number of households earning between $10,000 and $14,999 annually. Perhaps some of the poorest households moved a modest step up into the middle class. But incomes of less than $14,999 are still poverty level.
The fact is that the number households earning less than $100,000 a year in San Francisco declined between 2005 and 2012 by 20,000. It’s highly unlikely that households earning less than $50,000 a year suddenly vaulted themselves above $100,000 a year or more in income. Everything we know about socio-economic mobility tells us that this kind of ladder-climbing, boot-strap pulling advancement just doesn’t happen in the real world. At the same time all of the other data we have about the economy today shows growing inequality, and that the trajectory for middle and working class families is downward mostly.
So what does the data mean? It means what’s already been said in the media over and over again: San Francisco is bleeding working class and middle class residents. But it also means that San Francisco is becoming a city dominated by upper-income groups, both in terms of the sheer numbers of wealthier households, and perhaps too in the political and market power they’re now using to shape the city’s future.
While 20,000 poor and middle-class people were pushed out of San Francisco since 2005, the total number of upper-class households has exploded, with those earning more than $100,000 a year growing by 44,600 to a total of 134,000. The wealthy are not only displacing households that earn less than $100,000 a year, they’re also filling up much of the new housing that is being built.
The particular levels of lavish income claimed by San Francisco’s new top earners are also grossly understated by these Census figures. For example, it may seem somewhat sloppy to lump all households earning between $75,000 and $99,000 together as the Census does (after all an extra $25,000 goes a long way). But then again, consider that these Census stats have lumped everyone earning above $200,000 together. Thus there’s no way to tell how many of these affluent newcomers are earning say exactly $200,001, or maybe $50,000 more than that, or something radically higher, like say $79 million. That’s what Larry Ellison, a sometimes resident of San Francisco, was paid last year.
Twitter’s top lawyer was paid $15 million last year.
The really big money in San Francisco, elites whose incomes are hard to even estimate because their earnings arrive mostly in the form of capital gains, not as a salary or stock awards, further complicate the problem of trying to measure the new wealth that’s pouring into the city. For example, the net worth of Peter Thiel, the tech investor and Marina resident who owns parts of Facebook and Airbnb, shot up from $1.4 billion to $2.2 billion last year. To put that in perspective, there are at least 50,000 households at the bottom of San Francisco’s economy whose combined total income in 2013 was smaller than the dollar amount by which Thiel’s fortune increased.
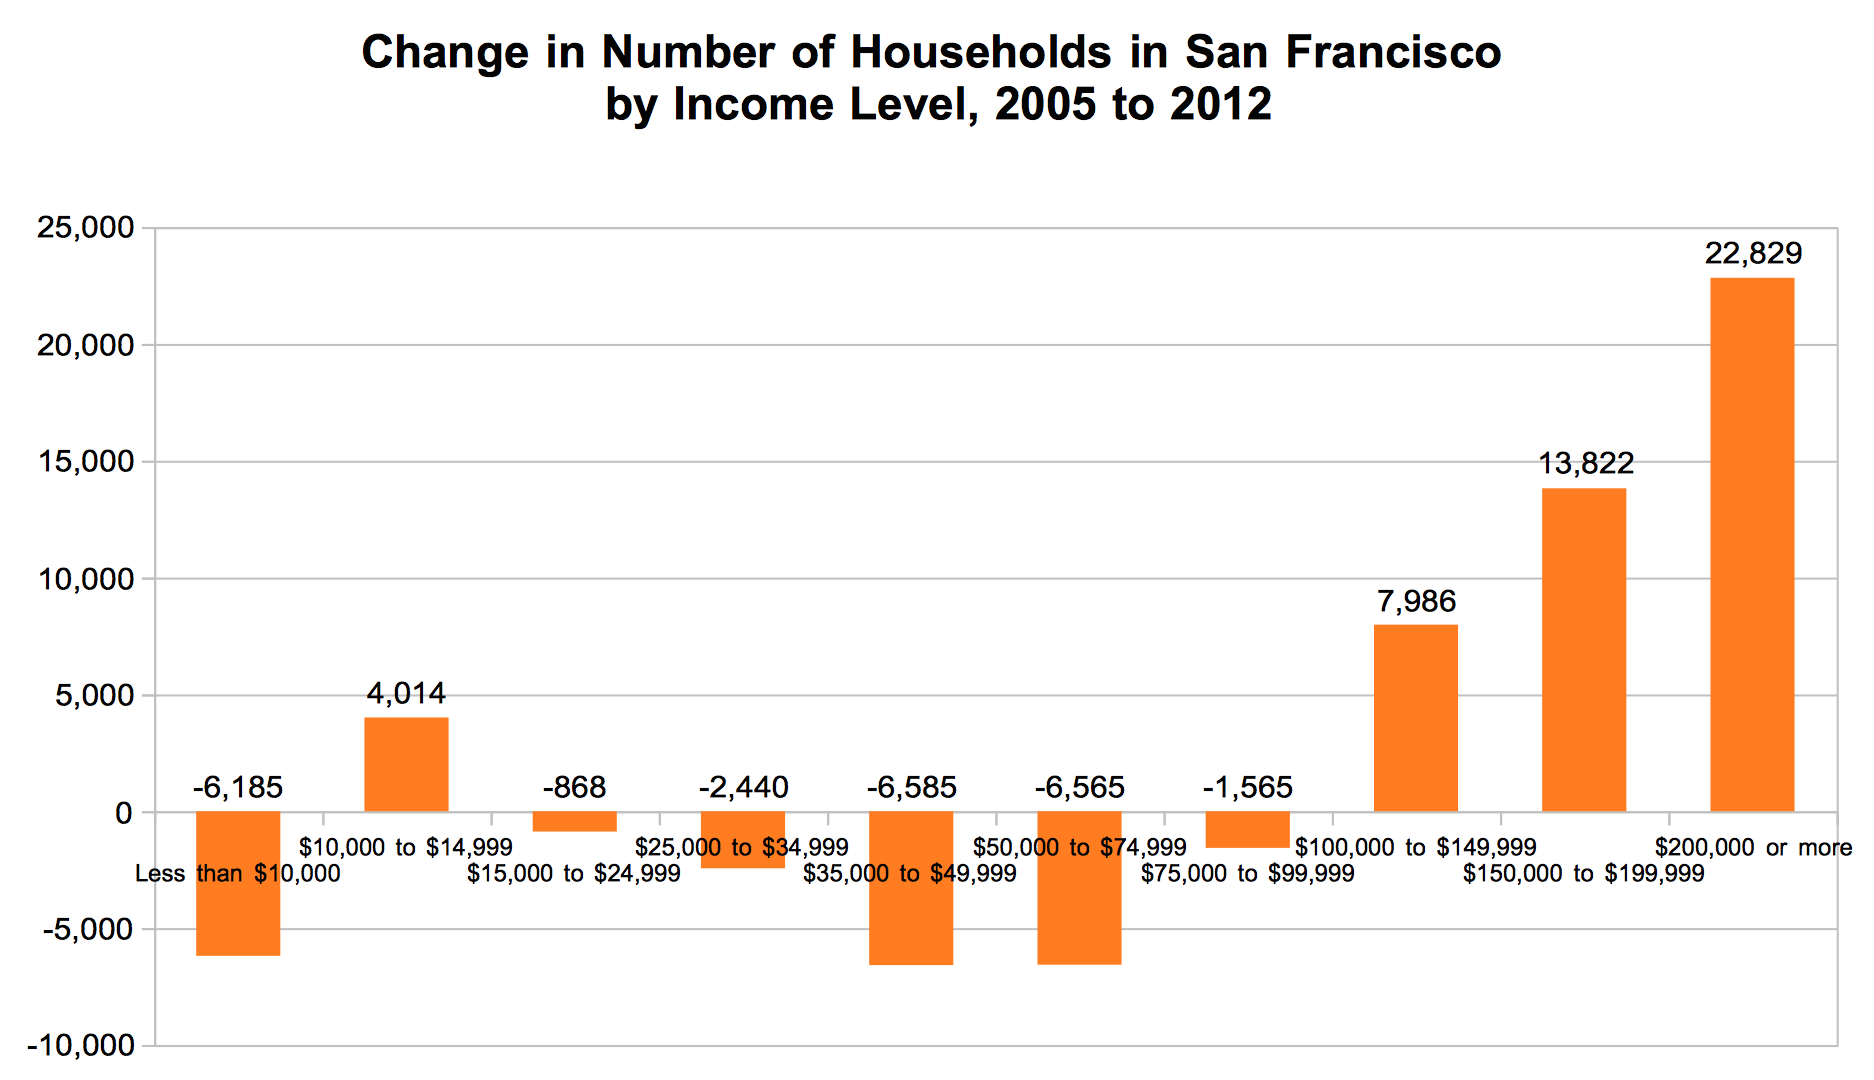
The best way to visualize this dramatic decline of the working and middle class and the rise of the affluent is by charting the overall change in numbers of households by income bracket from 2005 to 2012. As the graph below clearly illustrates, households earning below $100,000 a year have left San Francisco by the thousands while the affluent have flooded in in even greater numbers.
So what’s in store for San Francisco? What does the future look like? If these trends continue, if San Francisco doesn’t implement policies to create more truly affordable housing and other public goods and services, then it might become a city that by 2020 has more households with incomes above $100,000 a year than below. By 2026 there could be more very rich households in San Francisco (those with incomes of more than $200,000) than households earning less than $100,000. That would be a top-heavy city in which the average resident is comfortably in the top five percent of America’s income distribution.
If we carry forward the observed demographic transformation of San Francisco another 14 years into the future, using the rate of change in household numbers for each income group between 2005 and 2012, we can try to visualize what the city will look like in the not-too-distant future.
If the rate of growth or decline for each household income group continues apace, the city’s demographic futures looks like the chart below. Households with incomes below $35,000 a year will drop by 6 percent every 7 years; those with incomes between $35,000 and $75,000 will decline at a rate of 15% every 7 years; while those with incomes above $200,000 a year will increase by an astonishing 97 percent.
If the rise of the affluent in San Francisco happens at a slower in pace, if it merely grows by the same absolute amount that it has between 2005 and 2012, then the city’s future looks like the chart below. Every seven years, the number of households earning less than $100,000 a year will fall by 20,000, while households earning more than $100,000 will increase by 21,000.
It’s not a pretty picture. It’s not sustainable. But it’s the demographic reality of what’s happening in San Francisco.